
Phenotypic Assays
Wide range of phenotypic assays to quantify and characterize cellular changes including viability, apoptosis, migration, and more.
Cells submitted to a certain treatment, whether via transfection or with drugs, often show phenotypic differences from untreated cells like changes in viability, apoptosis, cell cycle or even metastatic potential in the case of cancer cells.
The RNomics Platform offers a wide range of phenotypic assays to quantify and characterize these cellular changes.
Several devices at our disposal make it possible to carry out assays monitoring the phenotypic effects of a treatment either continuously (XCELLigence), at more or less frequent intervals (CloneSelect) or at the end of a determined period (ImageXpress).
Our Phenotypic Assays
Quantify and characterize cellular changes with our wide range of phenotypic assays.
High-content imaging
Endpoint fluorescence microscopy assays for cell counting, viability, apoptosis, and proliferation analysis.
Cell Count Assay
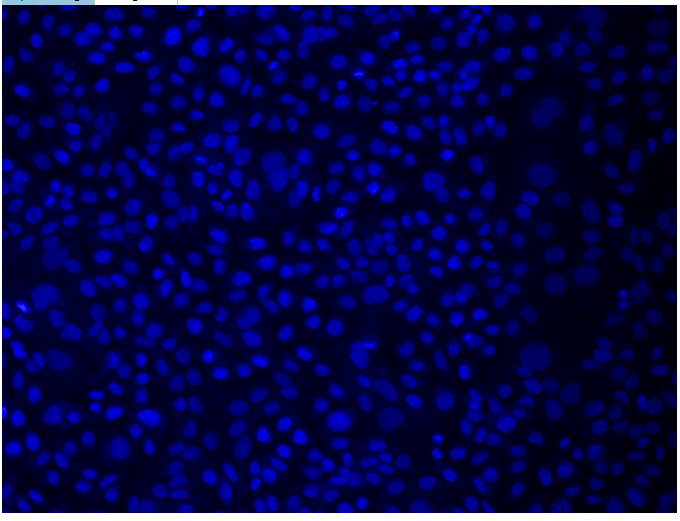
The cells are seeded in 96-well plates and then treated (transfection). After the desired duration of treatment, the cells nuclei are stained with Hoechst (Invitrogen Corporation) and image acquisition is performed with the ImageXpress microscope. Positive cells are counted and compared to control cells. Hoechst can be used in combination (multiplex) with other fluorophores (see viability and apoptosis assays below).
Viability & Apoptosis
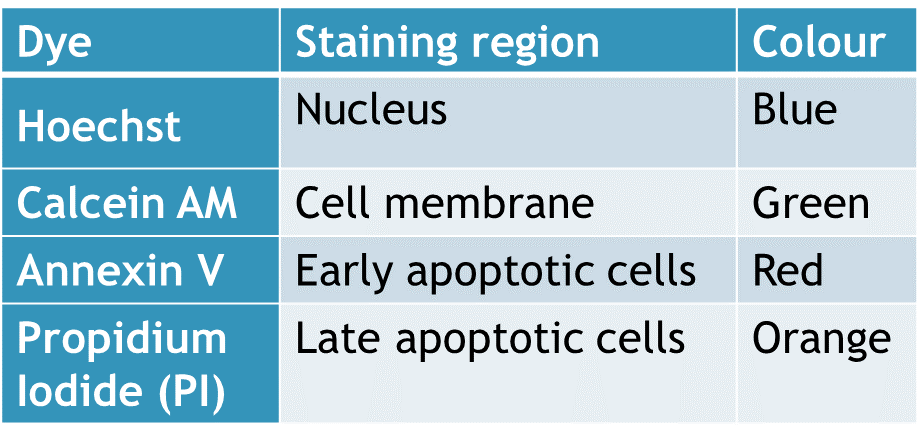
Cell viability (or loss of) is assessed using Propidium Iodide (PI) (Invitrogen Corporation) in combination with Hoechst. Hoechst stains all cell nuclei while PI only stains cells that are necrotic or at the end of apoptosis. At the end of a treatment (transfection), cells are stained and image acquisition is performed with the ImageXpress microscope. The percentage of dead cells is determined (Positive PI cells out of total cells stained with Hoechst) and compared to control cells.
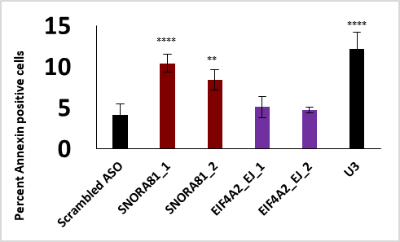
The marker we use for apoptosis is Annexin-V Alexa fluor 647 (Invitrogen Corporation). This molecule detects the translocation of phosphatidyl-serine (PS) from the inner surface of the membrane (undetectable) for healthy cells to the outer surface of apoptotic cells where it becomes detectable. At the end of a treatment (transfection), cells are stained and image acquisition is performed with the ImageXpress microscope where the percentage of apoptotic cells is determined (Cells positive for Annexin-V out of total cells stained with Hoechst) and compared to control cells.
Multiplex
By combining above mentioned fluorophores, we usually perform all these tests at the same time on the same cells, in a single acquisition of images under the microscope. Other dyes can also be added to the mix to obtain additional information according to your specific needs if wavelengths and buffers are compatible.

BrdU (5-bromo-2′-deoxyuridine)
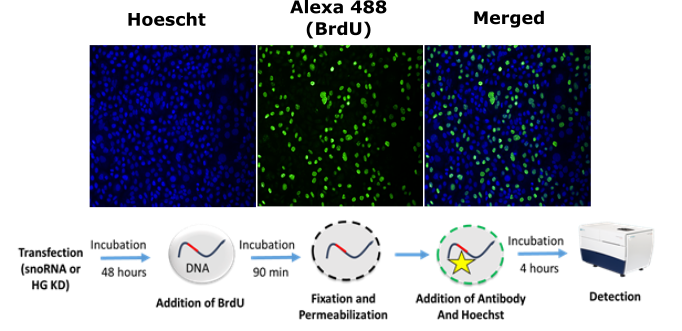
This test makes it possible to discriminate between a phenotype of proliferation or adhesion when a reduction in the cell count is observed. Similar percentage of BrdU positive cells to that of the negative control indicates an adhesion phenotype while a different percentage compared to that of the control rather indicates a proliferation phenotype.
Real-time impedance monitoring
Continuous, label-free cell monitoring using impedance technology — for growth curves, migration, and invasion assays.
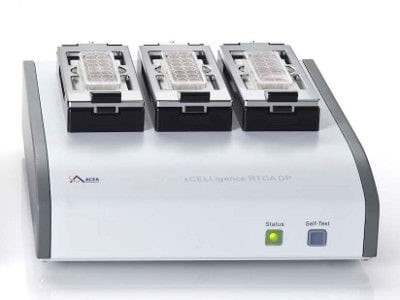
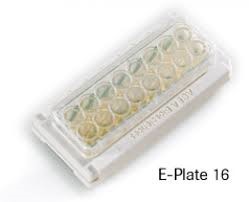
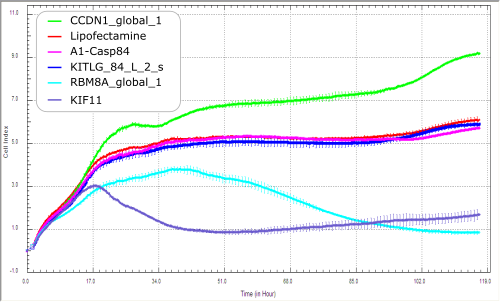
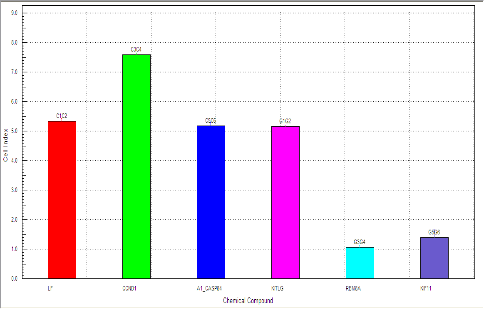
Alternatively, the XCELLigence (ACEA) device with its E-plates (16 wells/plate) can be used for real time visualization of cell growth without the use of fluorophore using impedance technology.
Migration / Invasion Assays
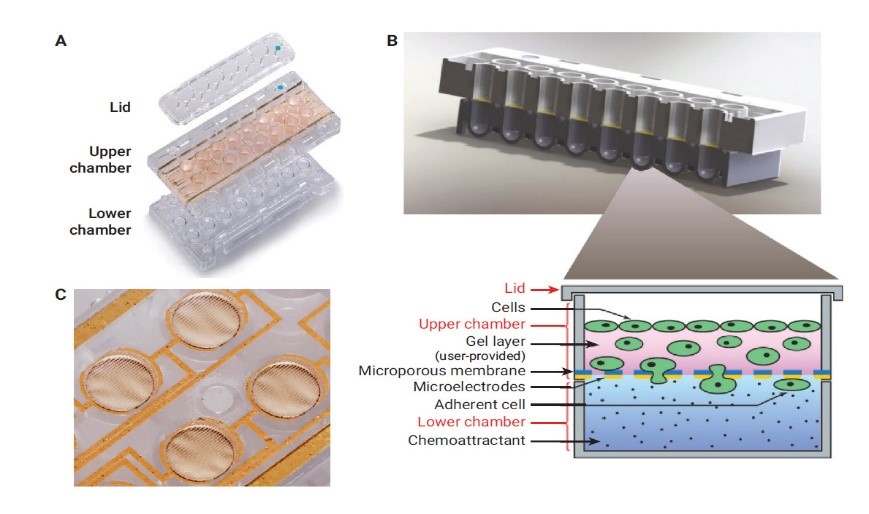
Using the XCELLigence (ACEA) device and CIM-plates, one can visualize the rate of cell migration or invasion. The CIM-plates are 16-well plates made up of 3 parts each (lid, upper chamber and lower chamber) behaving like electronic Boyden chambers making it possible to measure cell movements between the upper chamber and the lower chamber for each of the 16 wells.
The migration assay uses fetal bovine serum (FBS) as a chemoattractant. The cells seeded in the upper chamber with a medium without serum will migrate towards the lower chamber containing serum-supplemented medium by crossing the microporous membrane equipped with biosensors.
The invasion assay essentially consists of a migration assay except that a layer of Matrigel covers the surface of the upper chamber wells mimicking a layer of epithelial cells through which the invading cells must pass to reach the serum-supplemented medium.
Cell Cycle Analysis
Flow cytometry-based cell cycle profiling using propidium iodide on fixed cells.
Cell Cycle Assay
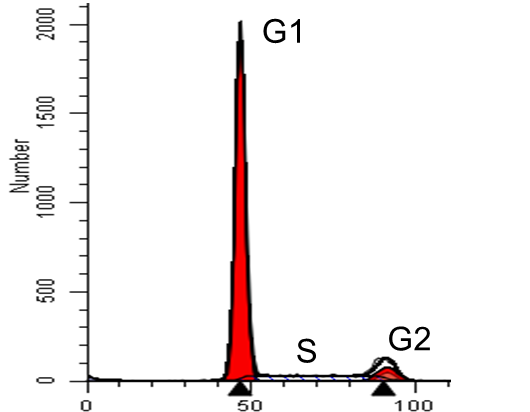
Analysis of cell cycle phases can be done using Propidium Iodide (PI) on fixed cells. The cells are harvested after a treatment of your choice for a determined duration, centrifuged and then washed with PBS. Cells are fixed with ethanol and treated with buffer H to provoke decondensation of the chromatin. After 30 minutes of staining with PI 10mg/ml, the cells are passed on the flow cytometer (FACS).
For Further Information
For further information on any of these assays, please contact us.